Once, while in New York, my colleagues took me to a zombie-themed escape room for “fun.” This was honestly the last thing on earth I wanted to experience. But before I knew it, I was locked in a small room with my peers, a “zombie” crawling on all fours, and thousands of bizarre objects to decipher to find an escape. It was solid frustration for an hour, with no outcome.
I had pretty much the same experience when I jumped into Google Analytics 4 (GA4) after using Google Universal for years–panic, frustration, and cluelessness.
GA4 is overwhelming and complex due to its new data model, event-based tracking, and steep learning curve. Most users have found it challenging to transition from Universal Analytics (UA) and get the needed reports. Despite using Google Analytics for years, it took a lot of time and a great course with Jellyfish to get my sea legs.
The platform offers a zillion numbers and reports, but the basic information is enough to gain valuable insights. Below, I will share the GA4 basics–the main numbers we focus on and what they mean for us and our clients. (No zombies included.)
Getting into Google Analytics
To start, you must sign in to Google Analytics at https://analytics.google.com/ using your Google login credentials. Access this through your own Google e-mail account (Gmail). If you are unsure how to find that, read our blog Getting into a Google Analytics Account: Help!
Sign in
1. Log in at analytics.google.com
2. Select the GA4 account you wish to review.
3. In the left sidebar, go to reports

Focusing on the basics in GA4
Once in GA4, you’ll land on a home page with suggested reports. I usually skip past these and go straight to the essentials. For basic client reporting, we focus on the following basic metrics:
GA4 Acquisition Basics: Where users came from
- Number of Sessions
- Average Engagement Time per Session
- Events per Session
- Traffic Acquisition
GA4 Engagement Basics: What people did once they arrived
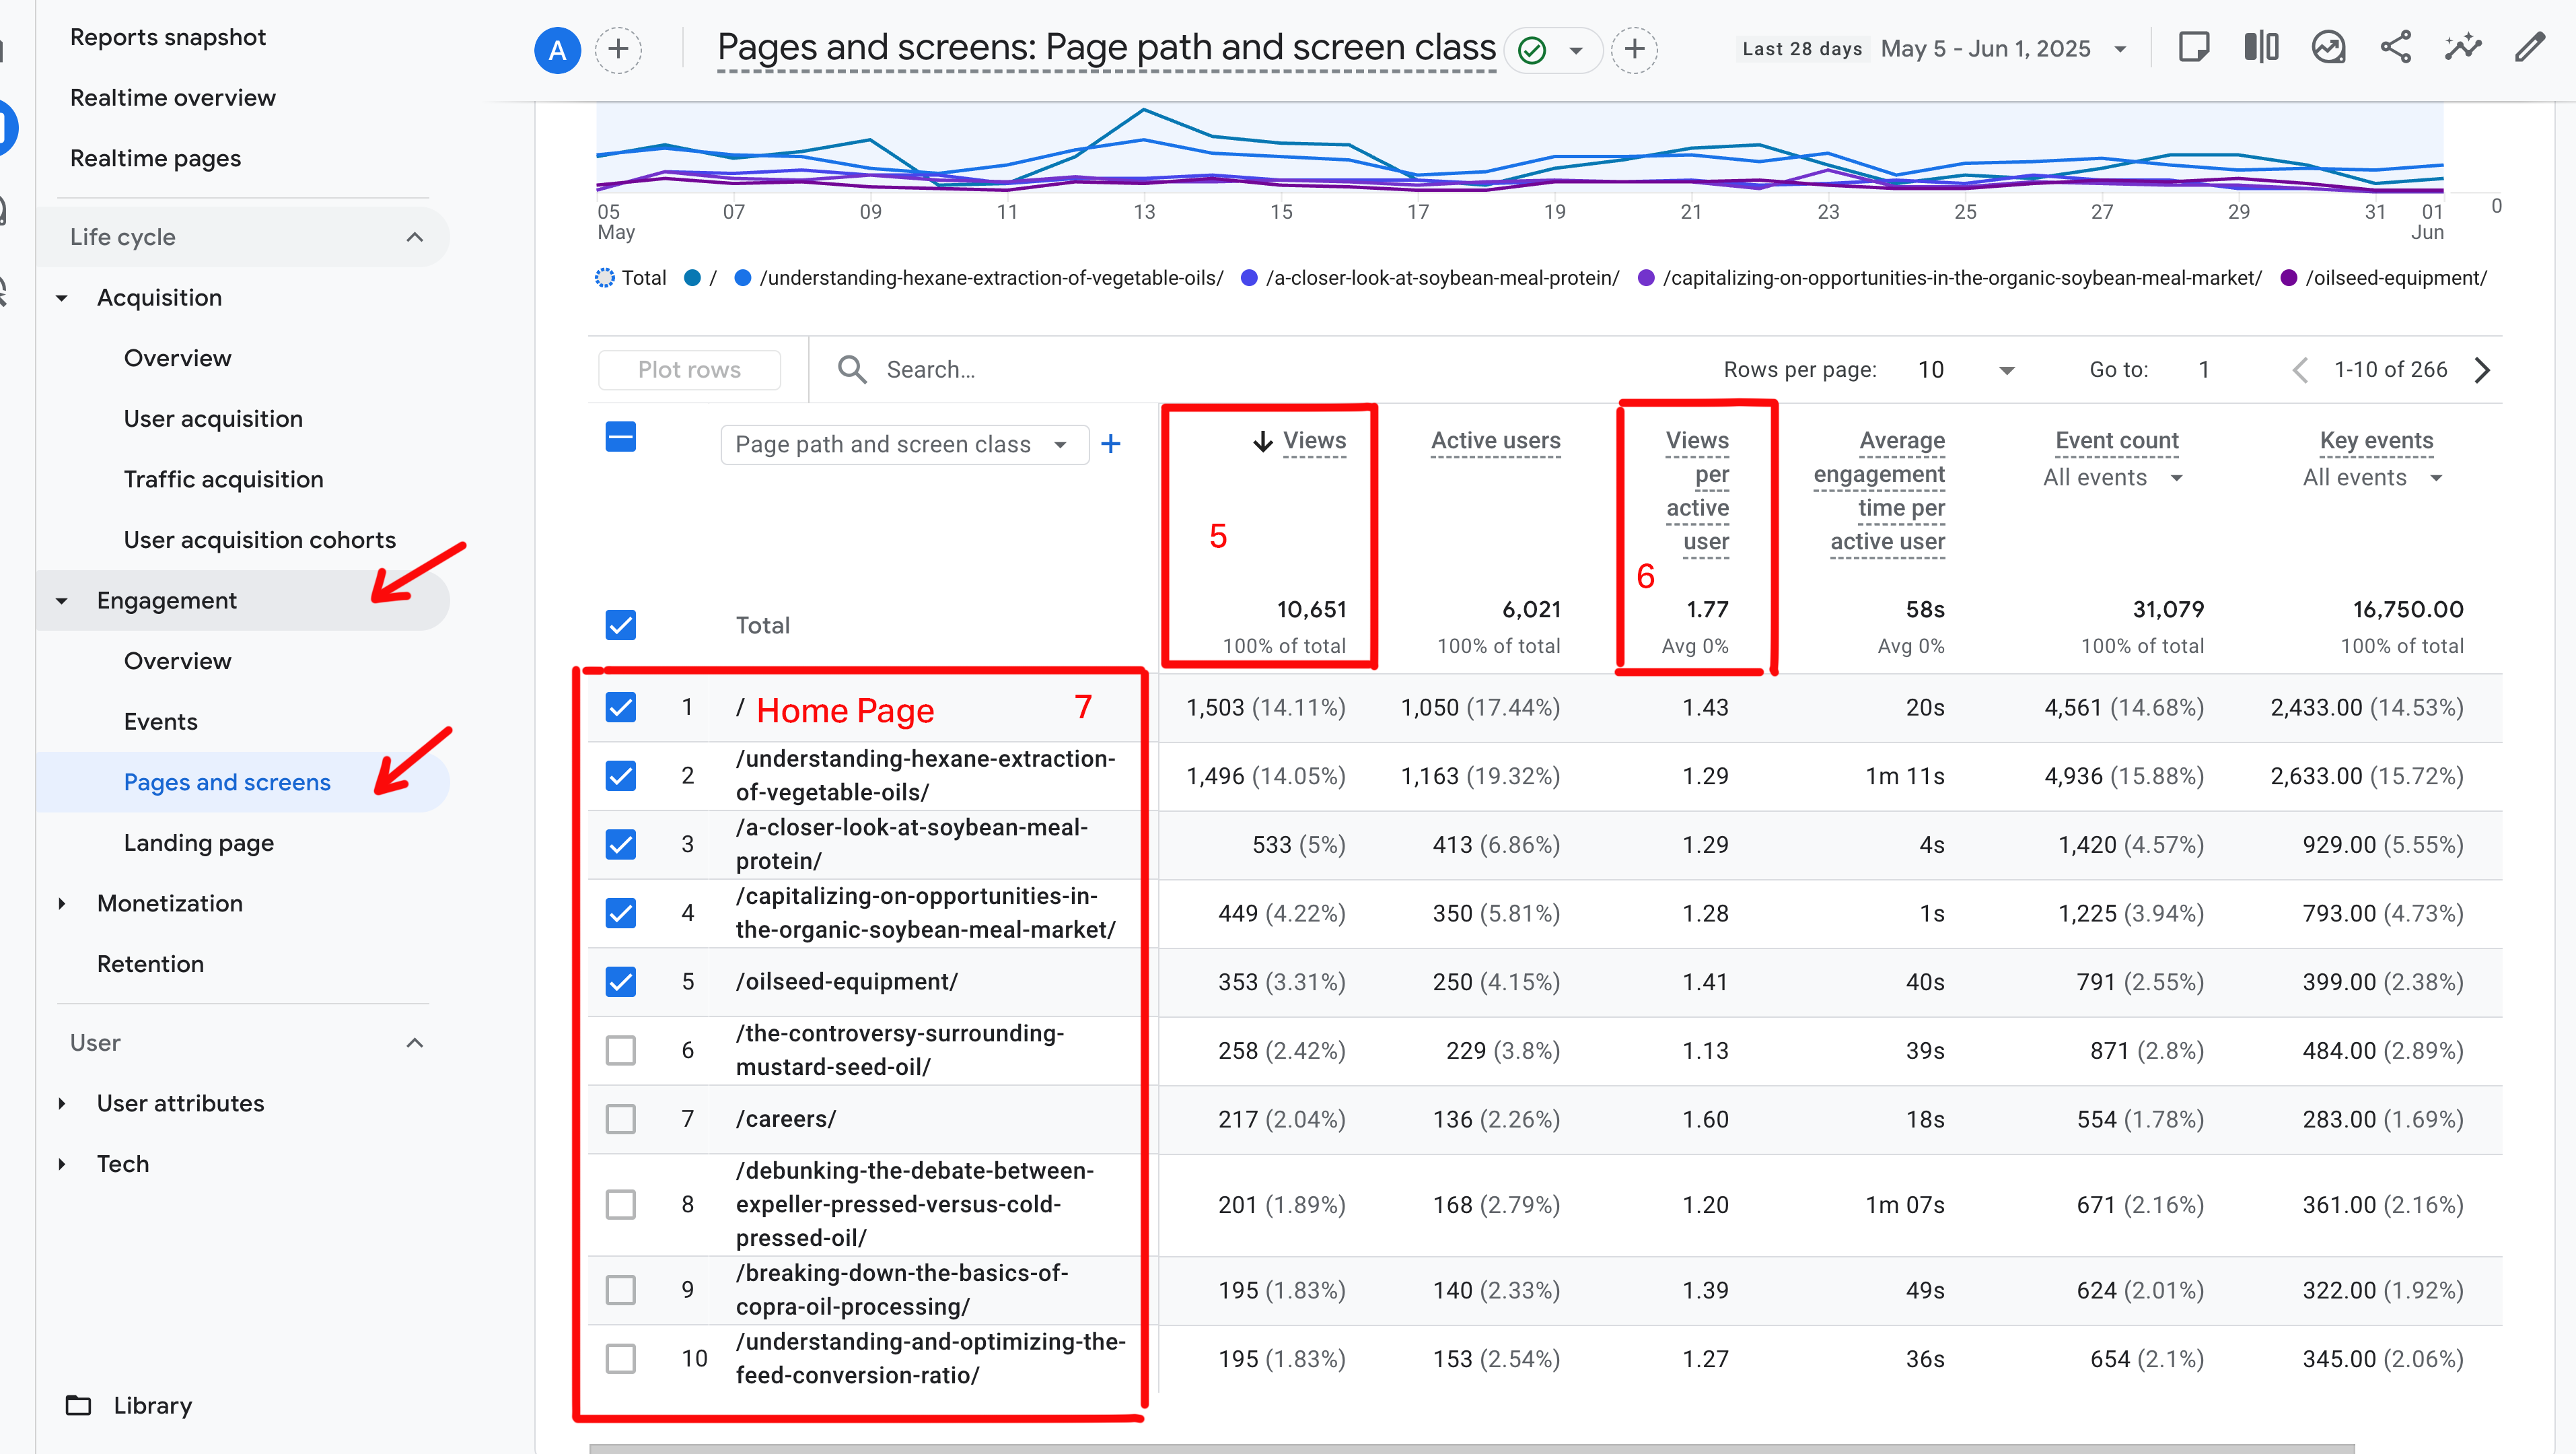
- Page Views
- Page Views per Active User
- Top Pages
You can access this data via the left sidebar navigation. Select Reports > Lifecycle > Acquisition > Traffic Acquisition. If you don’t see “Lifecycle” in the sidebar, you may need to enable it first—this video provides a quick walkthrough.
Before you dig in, make sure to set your desired date range. Note that you can also “+ Add Comparison” if you want a month-over-month view (or year-over-year, etc.) At Blue Star, we typically review and record metrics a few days after each month ends, tracking month-over-month performance in a spreadsheet for quick reference for each of our clients.
Let’s dig in!
Acquisition: The 4 numbers that show how people find your site
In the left navigation, click on Acquisition in the sidebar and select Traffic Acquisition. This area shows how people found your website—whether from Google Search, social media, email campaigns, or directly typing in your URL.

Traffic Acquisition shows the total traffic numbers underneath the graph at the top of the page.
1. Number of Sessions
A session is counted each time someone visits your site, regardless of how many pages they view. This metric is generally referred to as “traffic.” While benchmarks vary by industry and company maturity, a 10–20% month-over-month increase in sessions is generally considered strong for B2B sites with moderate traffic (5,000–20,000 sessions/month). (Source)
2. Average Engagement Time per Session
This is the average amount of time users stay and engage with your site during a session. For B2B companies, the average is about 77.6 seconds per session. (Source)
3. Events per Session
Events include all tracked interactions, such as page views, clicks, video plays, or form submissions. A typical site sees 1–2 events per session, while 3 or more indicate high user engagement.
4. Traffic Acquisition
As you scroll down, you will see a listing of where all the views to your site originated:
- Direct = Website traffic coming from someone typing your URL directly into their browser, a saved bookmark link, a link from a non-web document, links without URLs, or views from private browsers.
- Organic Search = Website traffic that comes from search engine results.
- Referral = Visitors who visit your site via a link from another website.
- Unassigned = GA4 couldn’t figure out where the traffic came from.
- Organic Social, Paid Social, and Email = Can only be assessed if you are using UTMs. Read more on that here.
At Blue Star, we use these metrics to confirm that our organic SEO efforts are paying off for our clients. A rise in organic search helps us know that the current strategy is working. A dip in search might mean we need to reassess the strategy, cadence, or content. If we manage social media and implement email marketing for a client, we can see specifically how our work is impacting website traffic.
Website Traffic Benchmarks by Channel
- Direct: Visitors can access the URL or access via bookmarks. 32.6%
- Organic Search: Remains a primary driver of traffic. 25.8%
- Paid Search: Delivers high-intent visitors actively searching for relevant terms. 23.2%
- Paid Social: Increasingly significant for driving traffic. 6.9%
- Display Ads: Supports brand awareness but tends to have lower click-through rates 6.6%
- Email: While low volume, email offers the strongest form of conversions. 4.1%
- Organic Social: Limited impact; effectiveness varies by platform and content strategy. 0.9%
Engagement: The 3 numbers that show what people do on your site
In the left navigation, switch to view the Engagement section. This area reveals what people did once they arrived — how long they stayed, what they looked at, and whether they interacted with your content.

As you click into Engagement, the total traffic numbers are again underneath the graph at the top.
1. Page Views
The total number of times a page on your site was viewed, including repeated views by the same user. As this increases or decreases, assess the information to see if a recent blog spiked traffic or if viewers might be struggling to find what they need.
2. Page views per active user
The average number of pages each visitor views during their session or visit. For B2B, 2–4 pages per user is common.
3. Top Pages
Here, you will want to analyze whether key pages like Home, Contact, Pricing, or Product are in the top list. Are blog posts or resource pages bringing in meaningful traffic?
Pro tip: Conversions
Conversions are the key actions on your website that indicate success. You don’t have to be a professional to convert more visitors to leads. GA4 data helps you strategize.
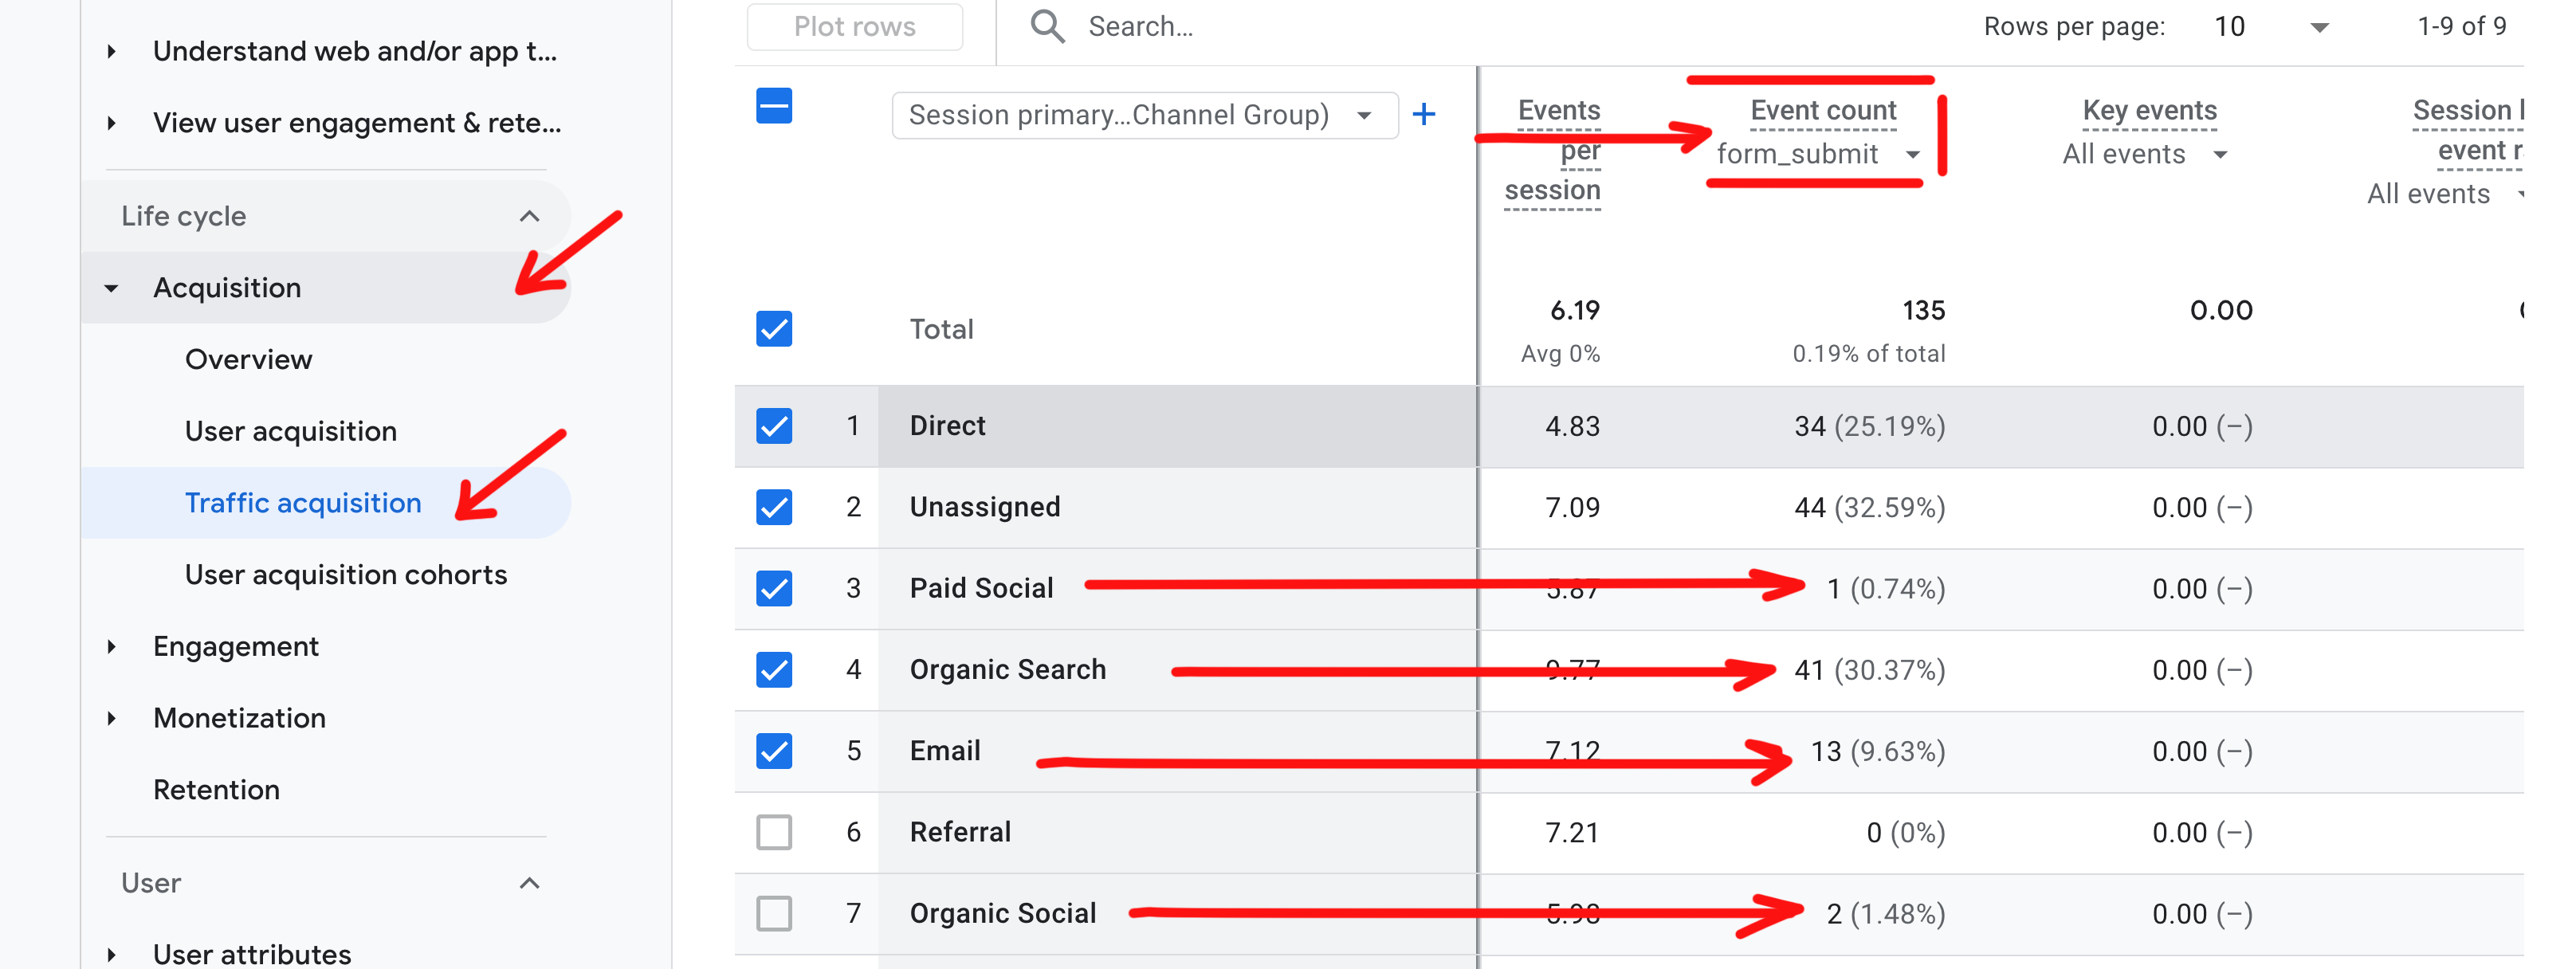
In GA4, conversions are tracked as events and signals that a visitor completed an important action. One typical example is the Form_submit event, which counts how often users successfully submit a form on your site. Tracking this helps you understand how well your site turns visitors into leads or customers, making it a vital metric for measuring the effectiveness of your marketing and user experience.
While you are looking at Traffic Acquisitions, scroll over to the right until you see Event Count. Pull down on the arrow and change to form_submit. Now you can see which traffic channels–direct, organic, or social–result in form fills.
This metric is especially valuable as it directly reflects potential leads generated from your website, making it a powerful way for marketing teams to demonstrate their impact. Showing consistent growth in form submissions helps prove to sales teams and executives that marketing efforts are driving real business opportunities, not just traffic.
(Note: If you don’t see form_submit in the events list, it may not be set up or set to trigger correctly. Contact your Google Tag Manager admin to review and resolve the configuration.)

Monthly metrics
At Blue Star, we track this data in a monthly spreadsheet to create a clear, at-a-glance view of website performance over time for our clients. This approach allows us to quickly identify trends, measure the impact of marketing efforts, and compare month-over-month performance without digging through GA4 more than necessary. It also helps us stay aligned internally and provide clients or stakeholders with straightforward insights tied to real activity on the site, whether that’s traffic spikes from campaigns, changes in engagement, or shifts in top-performing content.
Cracking the code
Even the basics of GA4 can feel like that escape room — full of unfamiliar terms, unexpected obstacles, and no clear direction at first. The good news? Unlike a zombie-filled escape room, there is a way out—and it doesn’t require solving cryptic clues.
Focusing on a few meaningful metrics and tracking them consistently can cut through the chaos and start turning your data into real insight—no pain, puzzles, or panic required.

